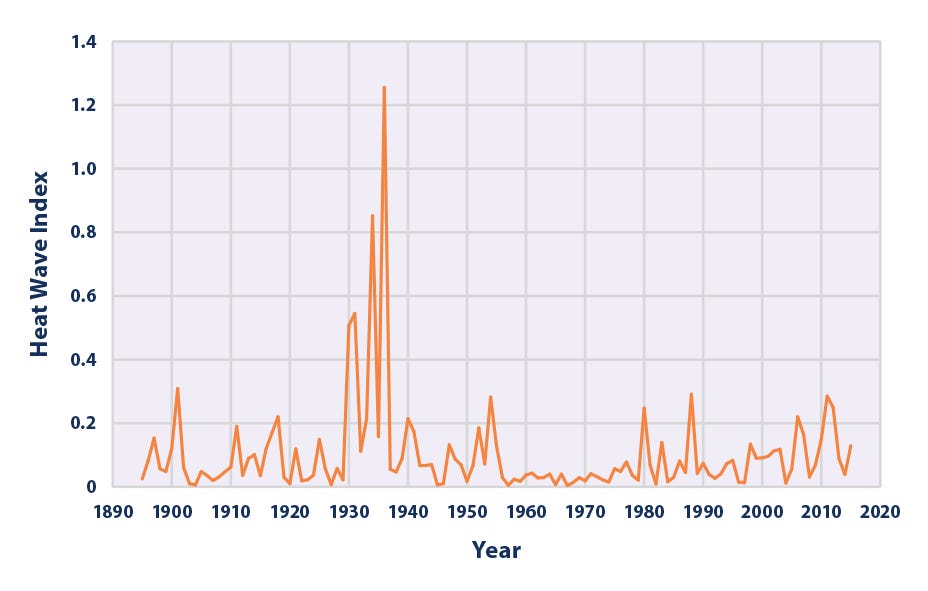
Misleading Climate Data: Revisiting the 1930s Heat Wave Plot
Visual representations of climate data can be powerful tools, yet they sometimes mislead. One such example is a plot depicting U.S. temperatures in the 1930s, which has been misused in climate denial discussions. This plot suggests that the 1930s experienced more extreme heat waves than recent decades, based on the heat wave index. This index measures the frequency of 4-day warm spells, where temperatures surpass a local one-in-ten-year threshold.
Originally published in 1999, the plot has undergone several updates, including a version on an EPA website in 2021. Despite its age, this plot continues to circulate in climate discussions, often misrepresenting its findings.
However, the plot’s data, derived from raw and unadjusted station records, contains significant biases. These biases affect both individual station records and the geographic distribution of stations, as discussed in previous analyses (here and here). By adjusting for these biases using the GHCN-daily and Berkeley Earth datasets, a different picture emerges.
In these adjusted datasets, the most extreme years are not dominated by the 1930s. According to the GHCN-daily data, the most extreme years were 1936, 2023, 1934, 1931, and 2011. The Berkeley Earth data presents 2023, 2011, 1936, 2020, and 1931 as the most extreme. These findings suggest that recent years have been as extreme as the hottest years of the 1930s.
Thus, once you account for biases in the data, you cannot conclude that temperatures during the 1930s over the continental U.S. were more extreme than those of recent years.
The heat of the 1930s was a regional phenomenon, centered in the U.S. Midwest, unlike today’s global temperature extremes. This regional heat was driven by natural climate variability and poor farming practices contributing to the Dust Bowl. During this period, aggressive plowing and the removal of native grasses left soils exposed and vulnerable to drought, exacerbating heat conditions.
In contrast, since the 1970s, the frequency of heatwaves has increased globally, a trend linked to climate change and elevated greenhouse gas emissions. This global signal differs significantly from the localized events of the 1930s.
Key Insights from Climate Data
The past provides context for understanding current climate phenomena:
-
The 1930s heat was regional, confined to the U.S. Midwest, representing a narrow focus that can be misleading when viewed in isolation.
-
Human activities, particularly poor agricultural practices, coupled with natural variability, were significant contributors to the Dust Bowl’s heat.
-
Post-1970s, heatwaves have become more frequent globally due to human-induced climate change, unlike the regional 1930s heat, which was not globally replicated.
Efforts to downplay today’s extreme heat by citing the 1930s as hotter are misleading. For those interested in examining the corrected figures or reproducing the analysis, the code is available here. Additionally, Prof. Adam Sobel offers insights into U.S. climate modeling in his Substack, which can be read here.
Original Story at www.theclimatebrink.com