
Used Vehicle Market Sees Slight Uptick in November
In the first half of November, the Manheim Used Vehicle Value Index (MUVVI) has seen a slight increase, signaling an intriguing shift in the wholesale used-vehicle market. With adjustments for mix, mileage, and seasonality, the MUVVI rose to 205.0, marking a 1.1% increase from October. Despite this rise, the index still reflects a 0.2% decrease compared to the previous year. Historically, November has witnessed a decrease of 0.6% in seasonally adjusted wholesale values for the entire month.
Wholesale Price Dynamics
Non-adjusted wholesale vehicle prices have declined by 0.5% from October to mid-November and are down 0.2% when compared year-over-year. This follows a trend of softening prices in recent months, with the long-term average indicating a typical monthly decline of 0.4% for November.
Expert Insights
“Wholesale depreciation rates were elevated in October, burning off a bit of the higher valuation levels seen most of this year. In early November, we’ve observed more moderate trends, which was a glimmer of what we saw right at the last week of October,” said Jeremy Robb, Interim Chief Economist at Cox Automotive. He noted that retail sales have slightly increased, and new and used loan rates have dropped by about 30 basis points since October, which benefits consumers. This data will provide clarity for the Federal Reserve as they prepare for their December meeting.
MMR Trends and Sales Conversion
In the first 15 days of November, MMR prices for the Three-Year-Old Index witnessed a 1.0% decline. MMR retention was at an average of 99.1%, a slight increase from October, but lower than the previous year by three-tenths of a point. Sales conversion rates improved to 56.5%, up by 2.2 points from October and more than a point year-over-year.
Takeaway: The MMR price decline was less than the typical rate of 1.2% for this period, indicating persistent inventory challenges. Sales conversion rates suggest seasonally normal demand.
Segment Performance and EV Impact
The overall market witnessed a modest 0.2% decline in prices year-over-year, supported by growth in the luxury and electric vehicle segments.
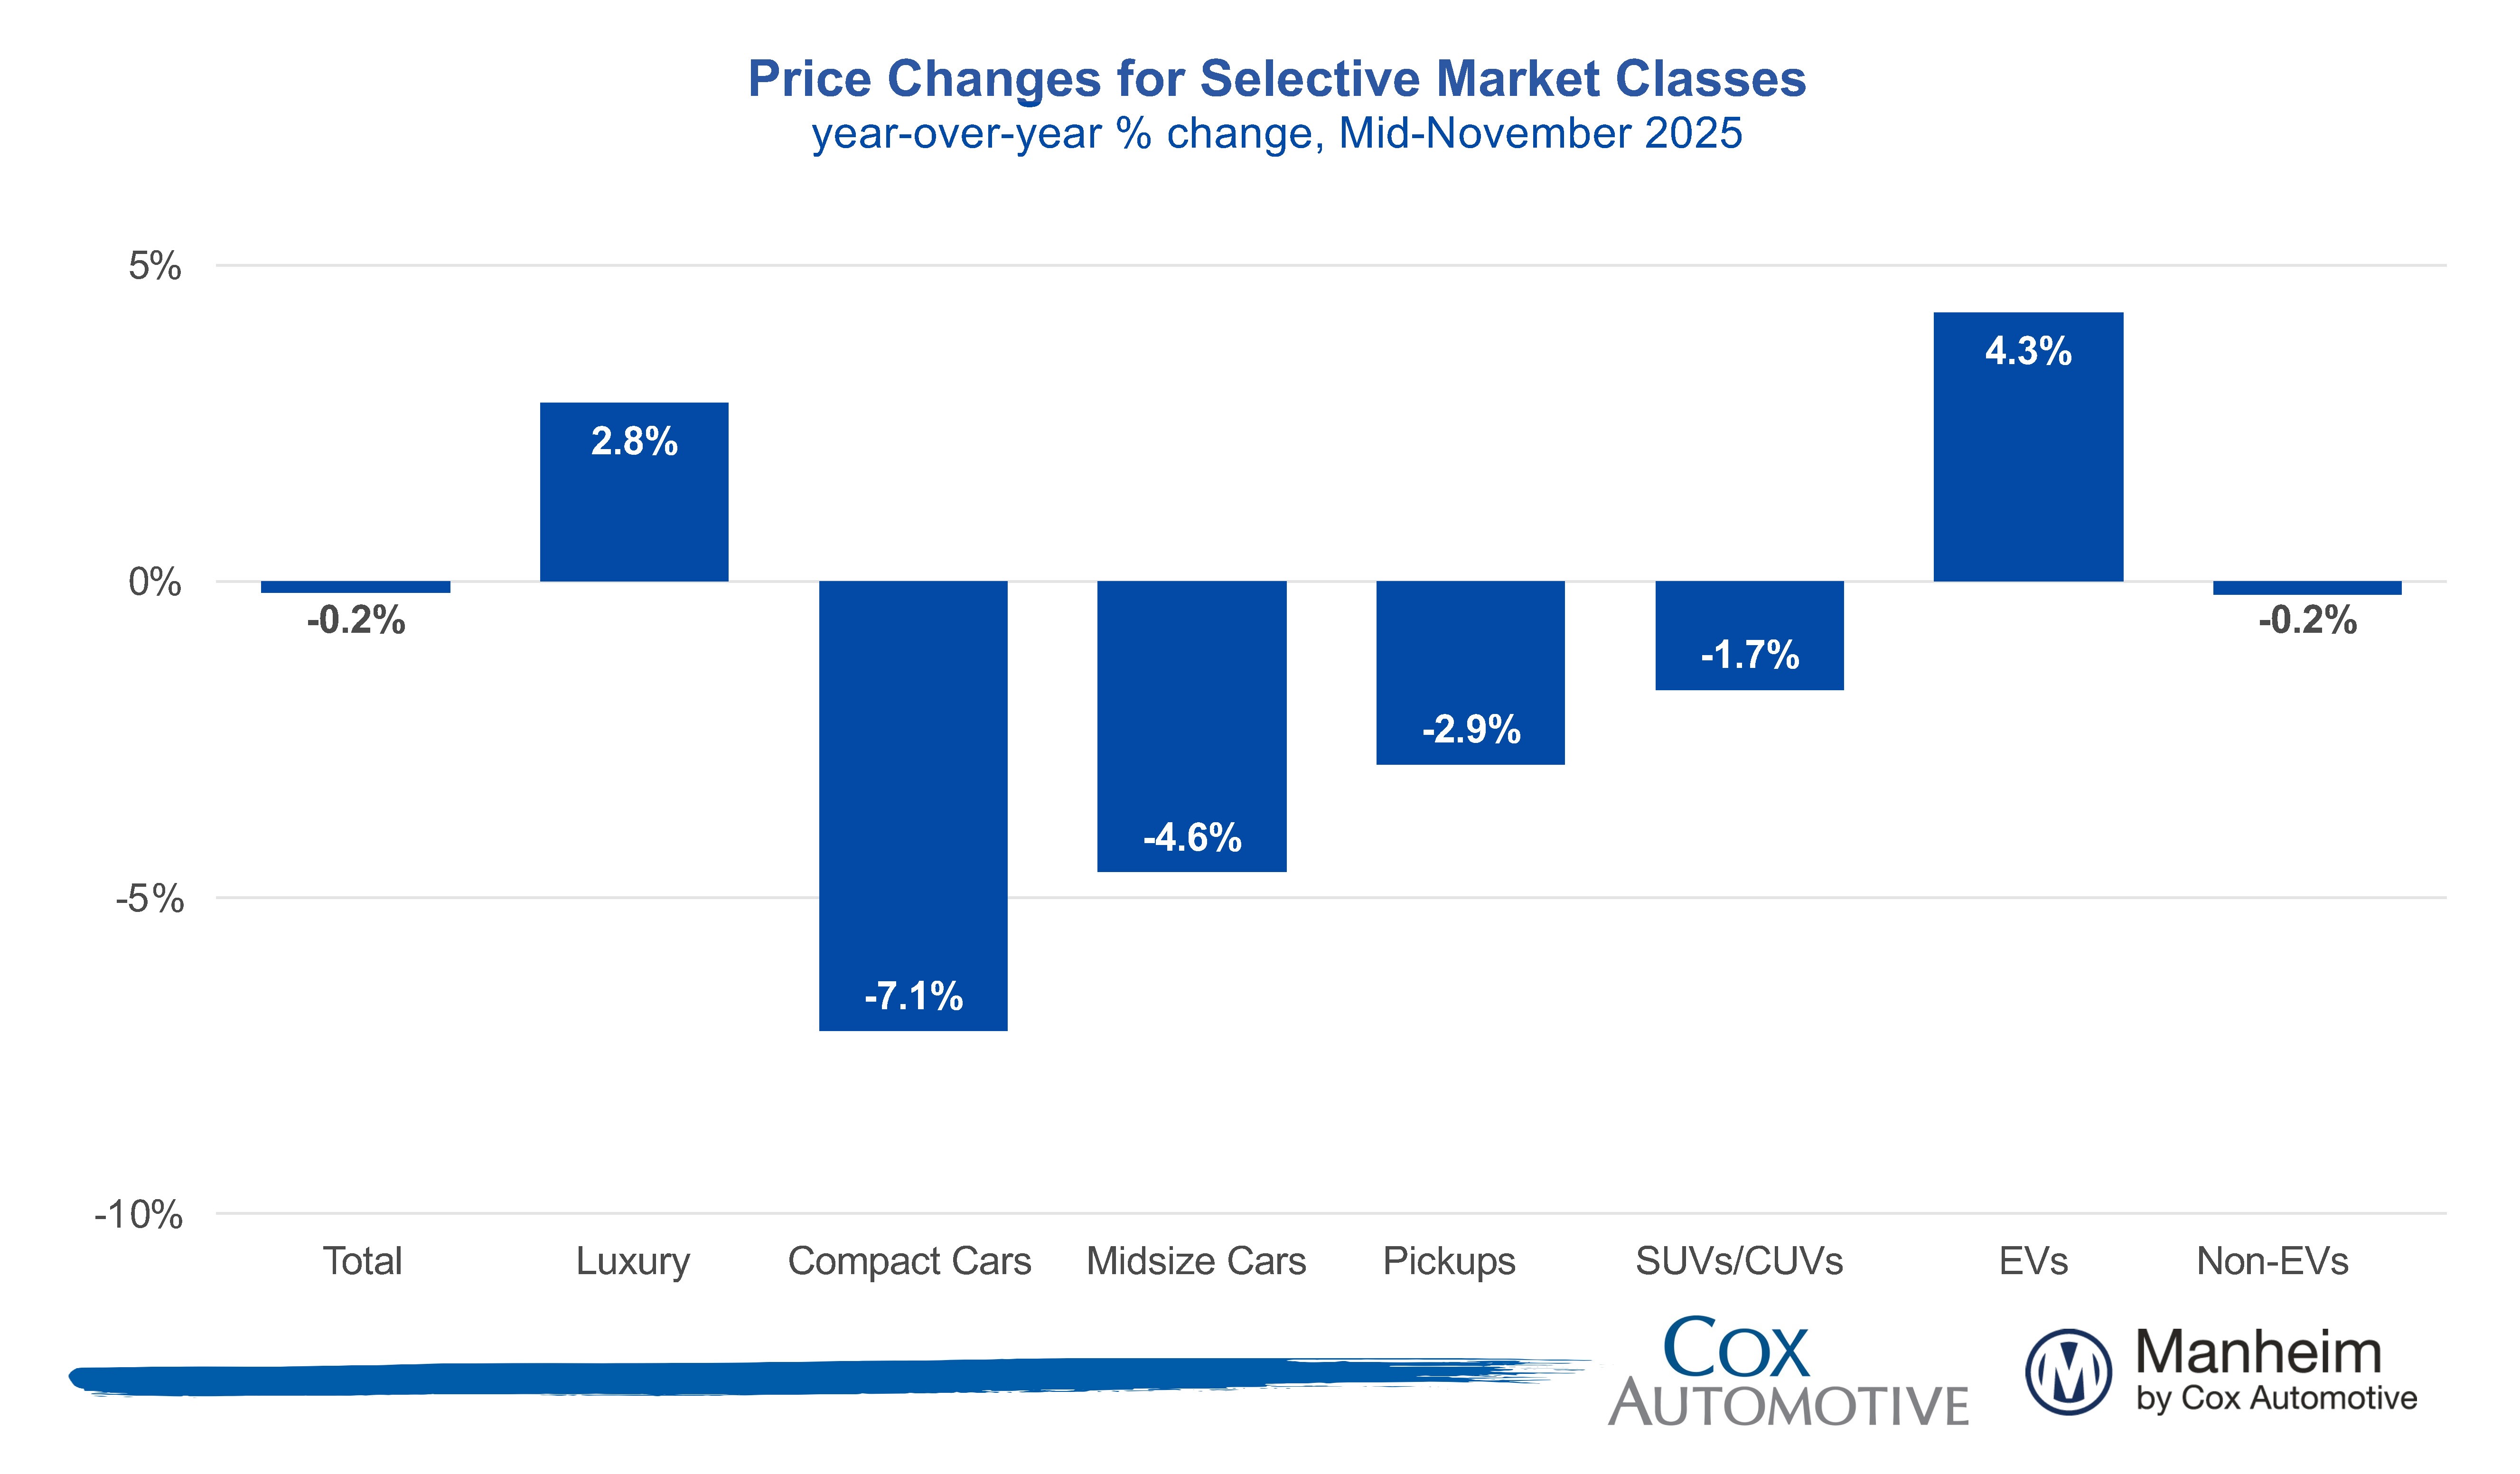
Takeaway: The luxury vehicle segment, driven by the electric vehicle trend, continues to outperform the market, although compact and mid-size cars face the largest declines.
EV Versus Non-EV Index
Electric Vehicles (EVs) have shown a 4.3% year-over-year increase, with only a 0.5% rise from October. Meanwhile, Non-EV values dropped by 0.2% year-over-year, but rose by 1.2% from October.
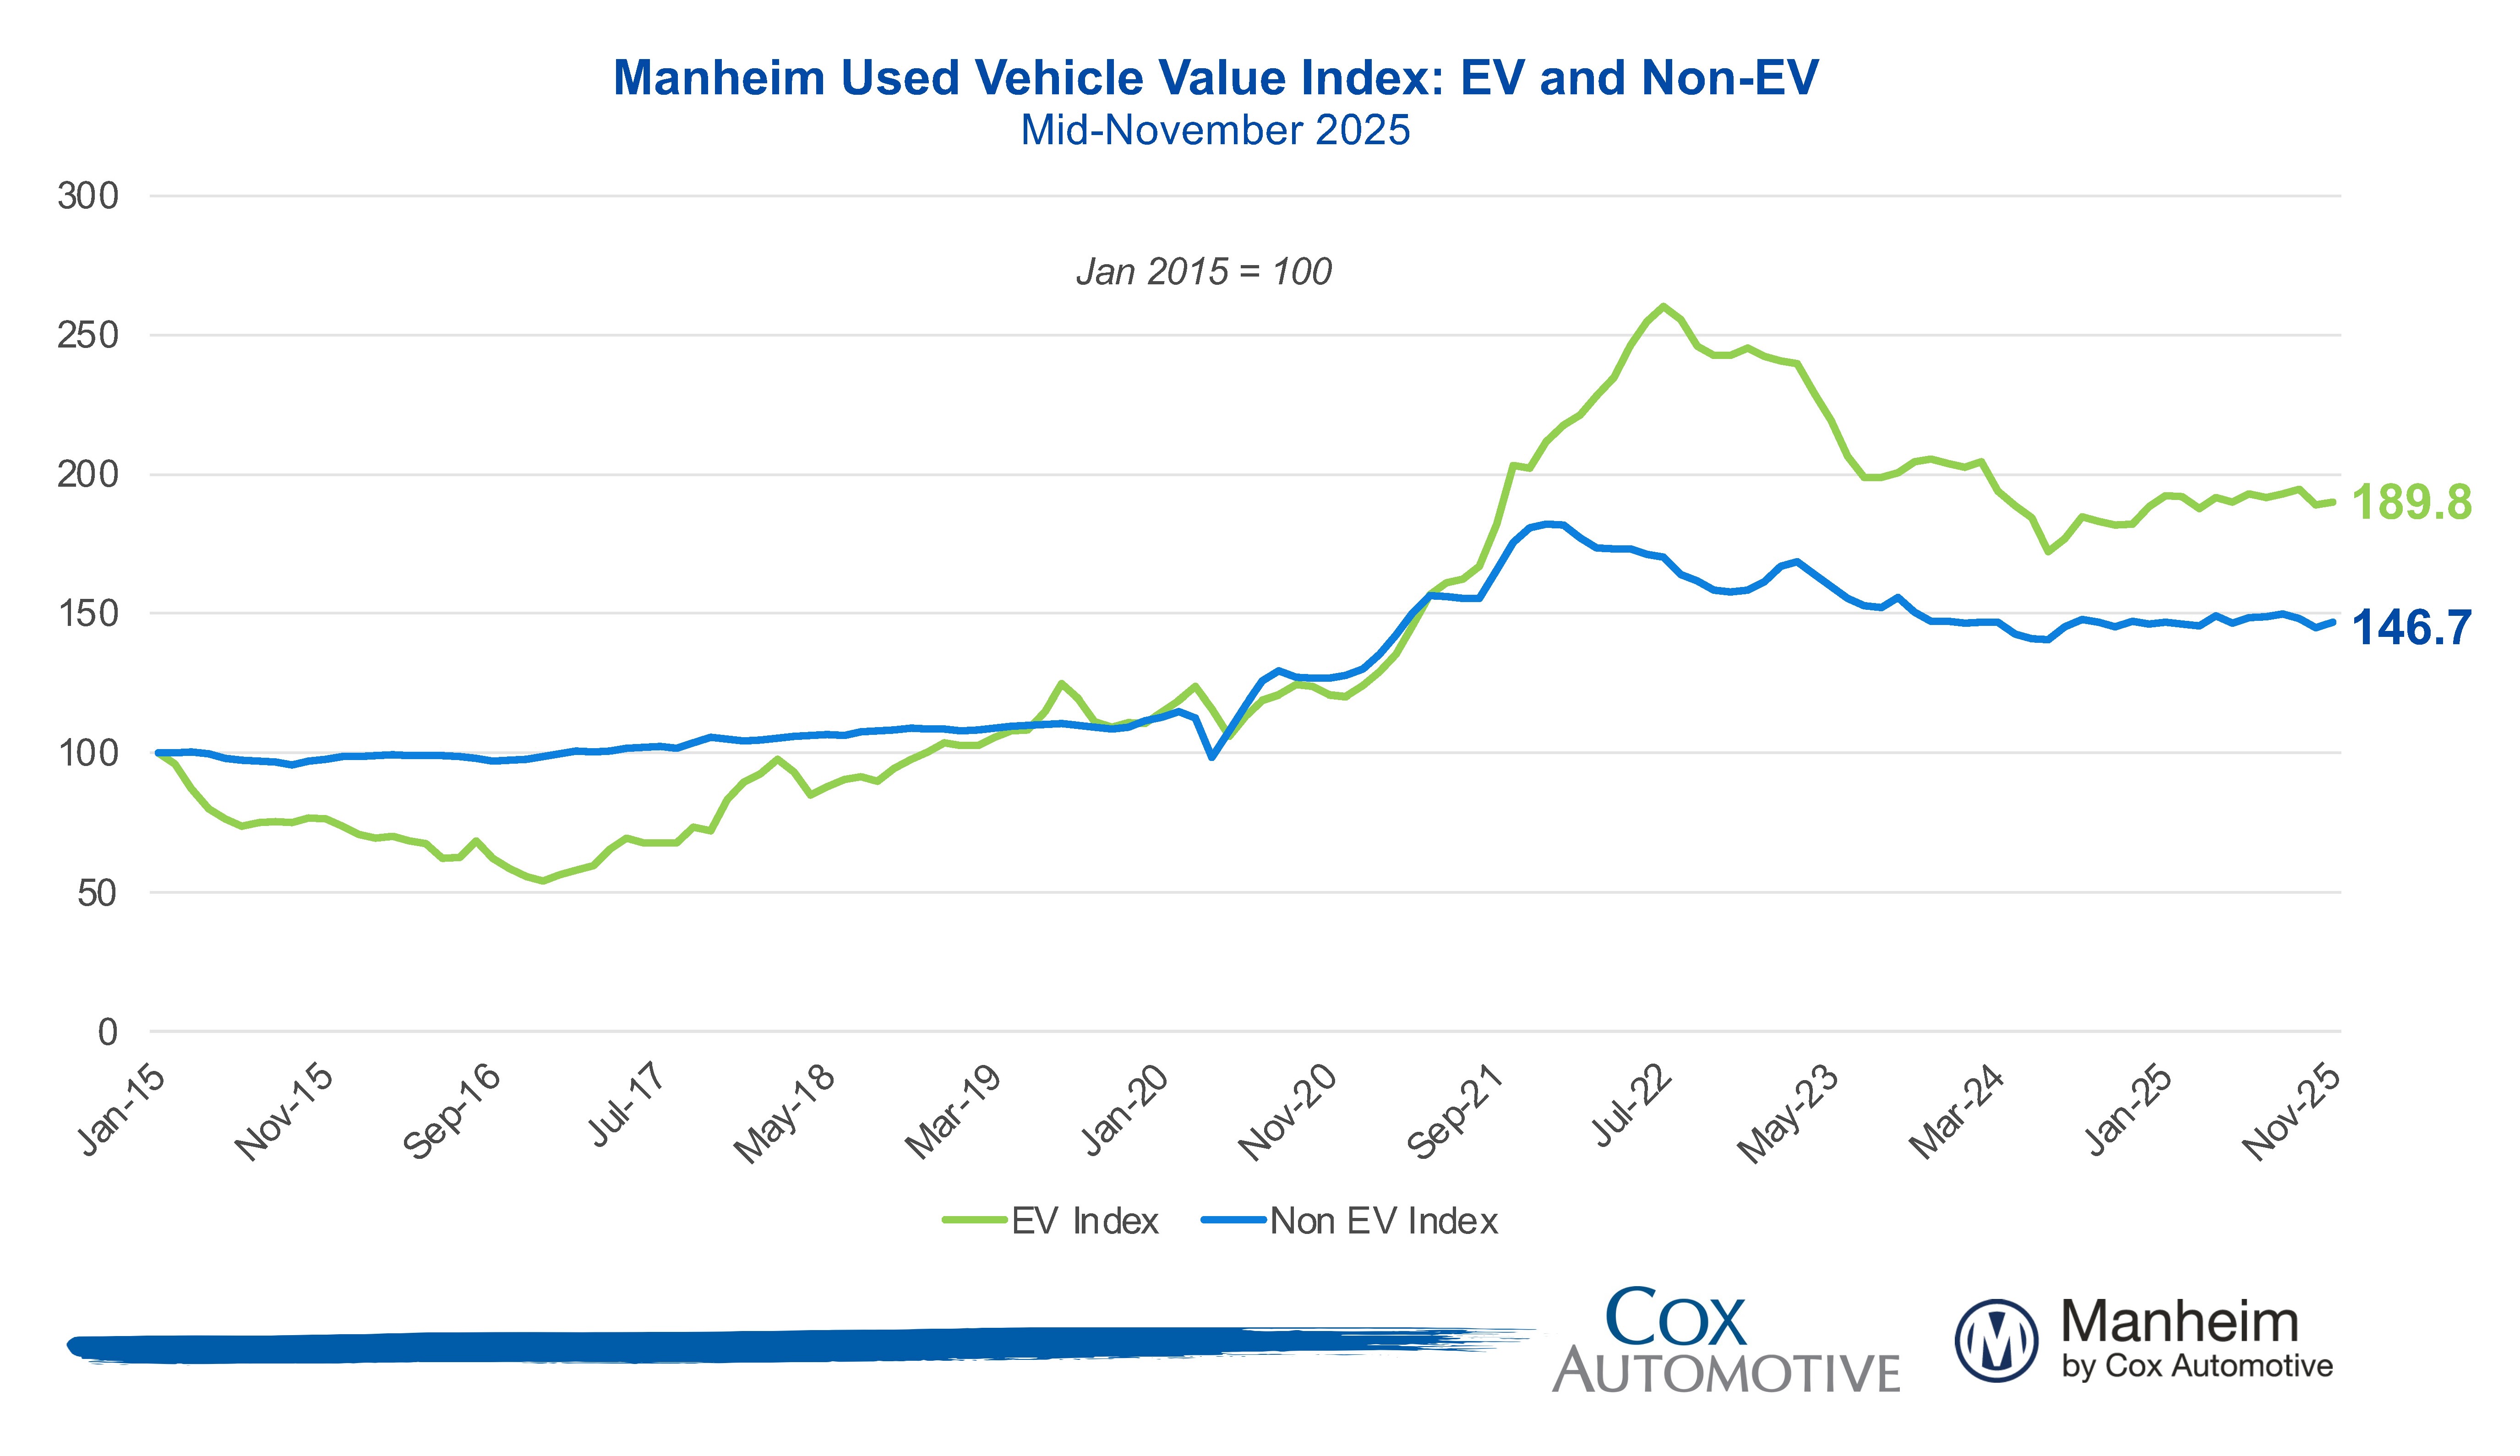
Takeaway: Despite the expiration of EV tax credits, EV values remain strong year-over-year, reflecting persistent market interest.
Wholesale Supply Overview
As of the end of October, the wholesale vehicle supply was at 28 days, up from 26 days in September, and equal to October 2024. By mid-November, supply had decreased slightly to 27 days.
Takeaway: Wholesale supply typically averages 30 days during this time of year, suggesting a tighter inventory in the face of sustained retail demand.
For More Information on Manheim: Visit Manheim.com
The Manheim Used Vehicle Value Index (MUVVI) serves as a key benchmark for tracking wholesale used-vehicle prices in the U.S., aiding dealers and analysts in understanding market trends. The official index is released monthly, with the mid-month figure acting as a preliminary checkpoint. The next full report will be available on December 5, 2025.
For inquiries or data requests, please email manheim.data@coxautoinc.com. To receive updates and quarterly call invitations, subscribe to the Cox Automotive newsletter.
Note: The MUVVI was rebased to enhance accuracy, starting from January 1997 with a base index of 100. This adjustment ensures consistency across the data set. Learn more about the rebasing decision.
Original Story at www.coxautoinc.com